Calibrating Assisi FVS Lake States to One Forest
A local calibration scales Assisi’s implementation of the FVS Lake States variant to one forest and extends it with submodels, using over 50 years of remeasured permanent plots, while the published coefficients remain unchanged.
In Essential FVS, the user’s guide to the Forest Vegetation Simulator, Dixon (2002) writes that “the range of an FVS variant can be effectively extended by judicious use of scaling factors and multipliers. However, changes should be approached with caution, and they should be based on increment and yield data.” A regional variant such as the Lake States variant (FVS LS) describes a region: its equations rest on large data sets that capture regional trends and competition well, which makes the variant a strong base for any one forest in that region, although not a measurement of it.
In FVS calibration, the data an organization holds determines how far a local calibration can take that base. Repeated measurements of the same plots support scaling, which adjusts the level of what the variant already predicts, such as diameter growth and mortality by species and tree size. Other records support submodels, which add predictors the variant lacks: tree vigor and damage recorded on each tree support terms for tree condition, management history, recorded or inferred from the remeasurements, supports a response to thinning and harvest, and seedling and sapling counts support a pathway that carries the inventory’s own small trees to merchantable size.
This article describes an FVS calibration of Assisi FVS Lake States that uses all four kinds of record, built from over 50 years of continuous forest inventory (CFI) on a Lake States ownership and released with Assisi 2026.4.4. Three further terms are used throughout. Fitting is the estimation of a model’s published coefficients from a new set of data. A local calibration leaves those coefficients unchanged and adjusts the model’s predictions with multipliers, added rates and submodels estimated from local remeasurements, the approach Dixon (2002, section 6.5) documents for FVS. A stock calibration is the model with no local calibration.
FVS Calibration in Assisi
Assisi FVS Lake States is Assisi’s implementation of the Lake States variant: diameter growth for large and small trees and the blend between them, height growth on the site index curves, crown ratio, crown competition, background mortality and density-related mortality, on a five-year cycle. The implementation was verified line by line against the FVS source code, and its published coefficients match those of FVS LS, 884 values across 68 species.
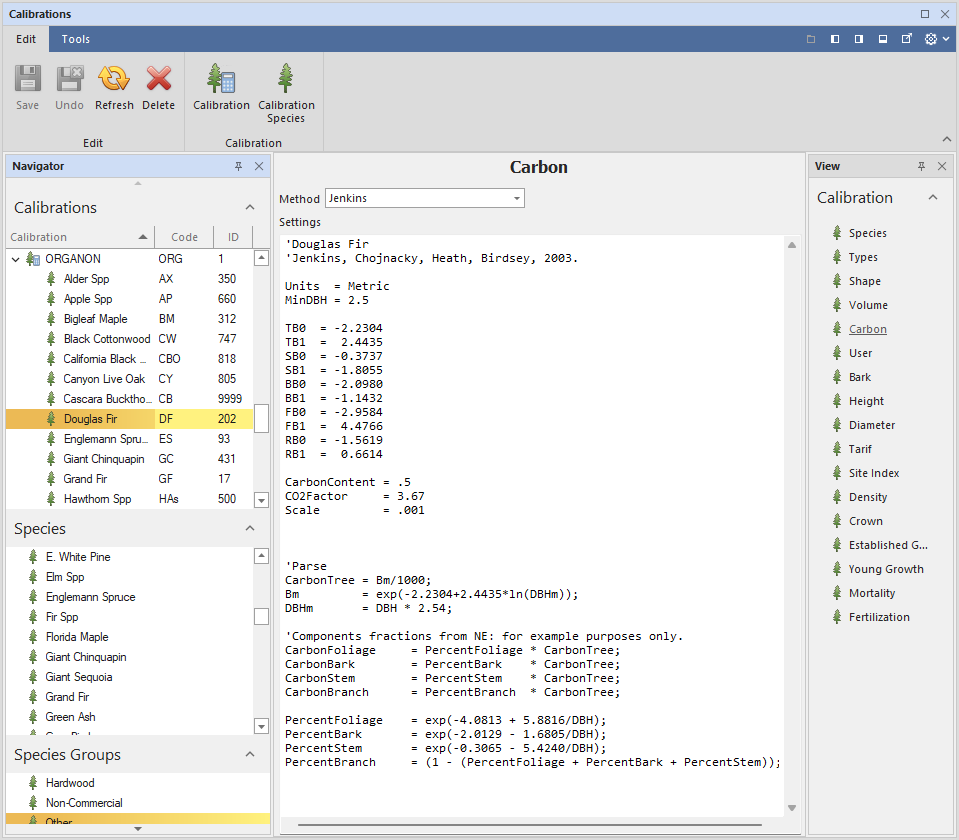
In Assisi a calibration is a named set of model settings and coefficients, stored in the forest database, under which a projection runs. A local calibration is therefore a second calibration beside the stock one, and the same stands can be projected under either for comparison. The Assisi sample database ships the stock calibration as Assisi FVS LS. The calibration described here belongs to the ownership whose data built it.
The Inventory
The ownership’s permanent CFI plots were measured six times over more than 50 years, most recently in 1999 and 2016. Trees 5.0 inches DBH and larger are individually tagged, and the tags are reliable: of the 65,834 trees matched between 1999 and 2016, 99.9% grew or held their diameter. Saplings, 1.0 to 4.9 inches DBH, are tallied by species in two diameter classes, and seedlings, stems under 1 inch DBH, by species without a diameter. The calibration is estimated on the 17-year interval from 1999 to 2016, and the earlier measurements supply each stand’s management history.
An FVS calibration compares what the projection grows with what the remeasurement found. A harvest that the projection does not carry out would otherwise appear as growth or mortality error, so each stand’s disturbance history is given to the projection. Recorded harvests from 1999 to 2016 are replayed tree by tree, 2,982 trees across 537 harvest events. Harvest records before 1999 do not exist, so earlier harvests and die-offs were inferred from tags missing at each remeasurement and classified by the loss of basal area: 80 intervals as clearcuts, 265 as thinnings and 60 as die-offs. Tested against 1999 to 2016, where both records exist, the method identified 17 of 20 recorded clearcuts.
Of the 813 stands carrying tags at both measurements, 352 recorded no disturbance between 2000 and 2016. These undisturbed stands were divided at random into two halves, so that each term was estimated on one half and tested on the other before it was adopted. The 450 stands harvested in the interval were withheld entirely and serve as an independent test.
Scaling and Submodels
Two of the calibration’s parts scale what FVS LS already predicts, and three add submodels with predictors that FVS LS does not have.
| Part | Kind | Growth | Mortality |
|---|---|---|---|
| Species | scaling | a rescale of the species’ growth | an added rate for the species |
| Tree size | scaling | a multiplier by diameter class | an added rate by diameter class and a multiplier by size band |
| Tree condition | submodel | multipliers for recorded vigor and crown damage | multipliers for vigor and for crown and root damage |
| Management response | submodel | a second rescale in managed stands that fades with the years since the cut toward a lasting floor | a rate set by the last disturbance and what it removed |
| Small trees | submodel | inventory seedlings start at breast height and take their first diameter from their height | an added rate on the smallest trees by species group |
Three candidate terms did not hold on the half of the stands withheld from estimation and were rejected: a tree-condition term that differed between managed and unmanaged stands, a site quality multiplier keyed on habitat type, and species-level mortality rates after a disturbance that removed no trees.
What the Remeasurement Showed
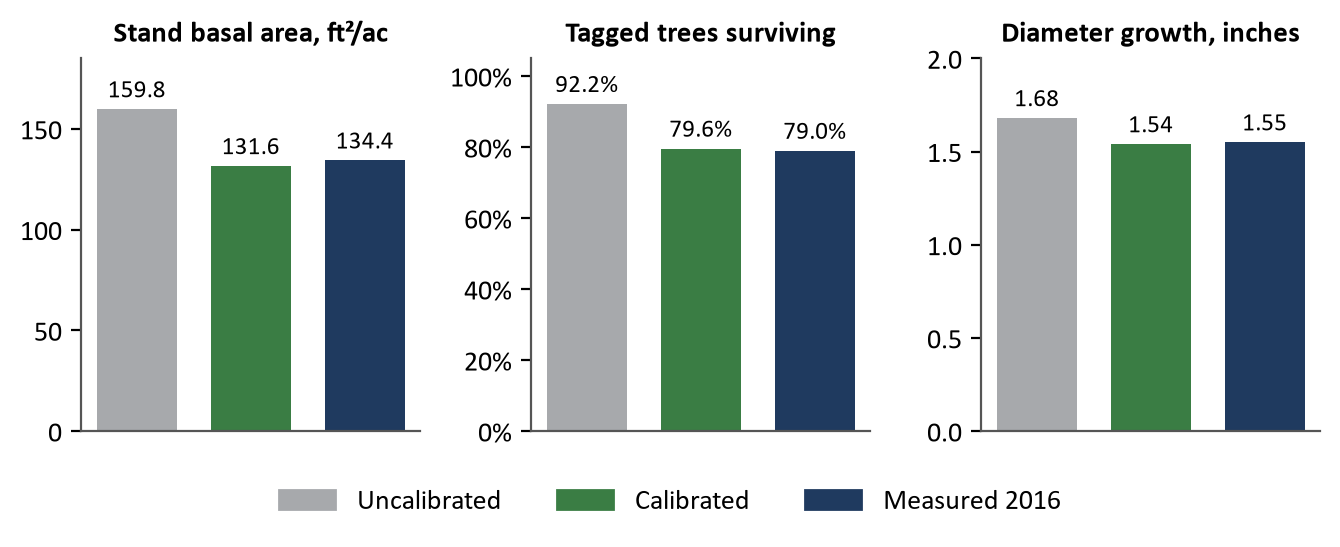
The stock calibration of Assisi FVS Lake States overstated the basal area of the undisturbed stands by 19% in 2016, because too few trees died and the survivors grew too fast. The size of each correction is itself informative.
- Species and size. The added annual mortality rate for trees 5 inches and larger is 5.1% for balsam fir, 4.0% for quaking aspen and 3.1% for paper birch, whereas the stock mortality of the tolerant species was close to the measurement. Measured mortality also rose steeply with size, so that trees 16 inches and larger died at 1.5 to 2.9 times the stock rate, and in managed stands the stock projection grew small trees too fast and large trees too slowly.
- Tree condition. FVS LS represents a tree’s condition only through crown ratio. The crews’ vigor and damage codes proved the largest source of information the stock projection lacked: a cull tree received the survival of a good one.
- Management response. Stock growth was 109% of measured on undisturbed stands and 80% on managed stands. Site, species composition and harvest intensity did not explain the difference, and it persisted for decades: a stand last managed before 1999 still grew markedly faster than one never managed. In stands harvested between 2000 and 2016, crews removed trees of good vigor markedly less often than other trees of the same species, so each entry leaves a more vigorous stand. The relationship is a correlation, although a usable one, because a stand’s history is known before a projection begins.
- Small trees. Starting each inventory seedling at breast height reproduced the measured species composition of the 1–2.9 inch class, and the inventory’s own small trees alone reproduced the number of trees crossing 5 inches between 1999 and 2016: 61.1 TPA projected against 61.1 measured on the 352 undisturbed stands.
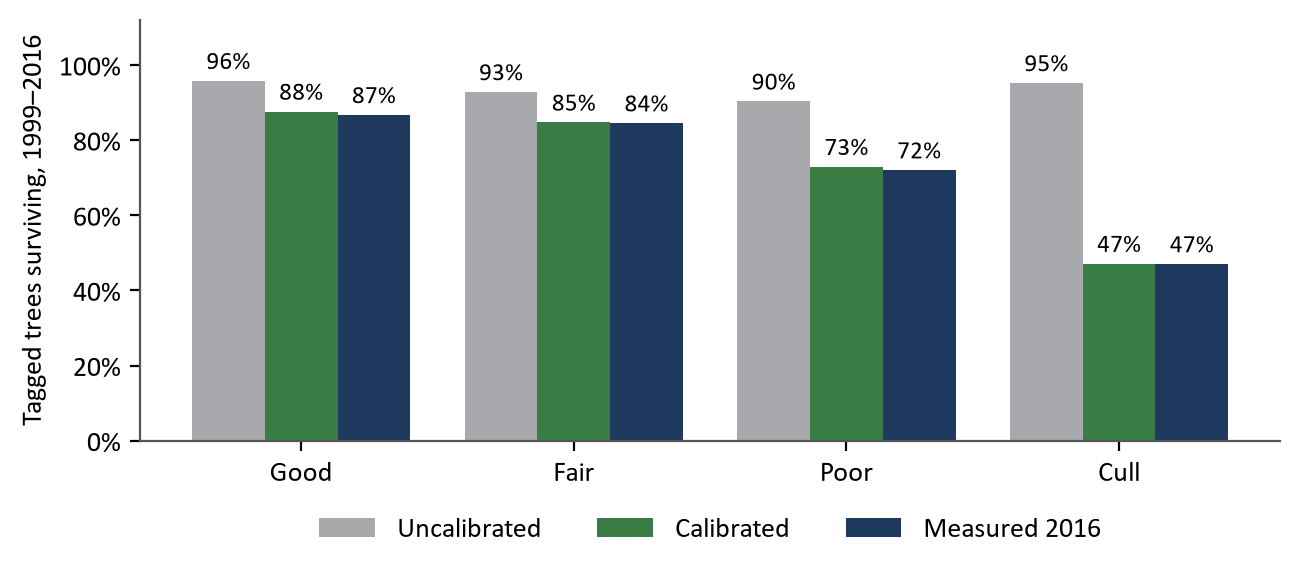
The vigor multipliers are centered, meaning that each species’ own rate is adjusted so that redistributing mortality between vigor classes does not change the species’ total. An error in how mortality is divided between vigor classes cancels in a stand total, although it matters considerably in any forecast of the value of standing timber.
Results
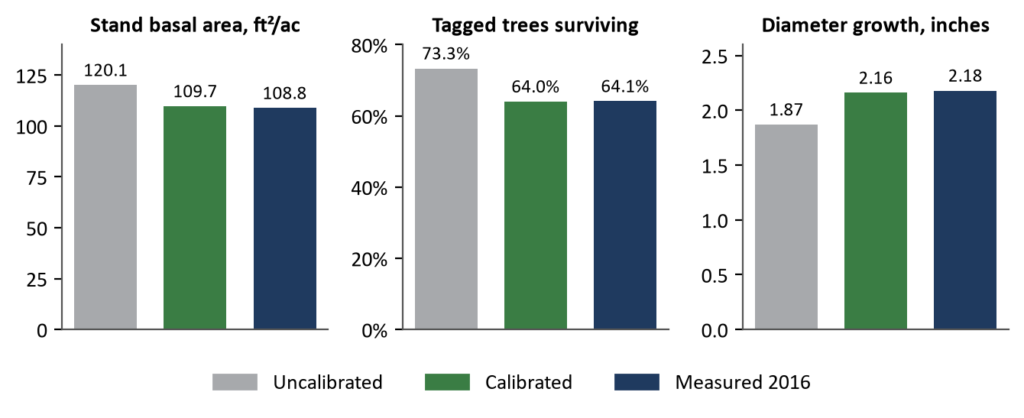
Each population was projected from the 1999 inventory to 2016 and compared with the 2016 remeasurement. On the undisturbed stands, Calibrated basal area was within about 2% of measured and survival within one percentage point.
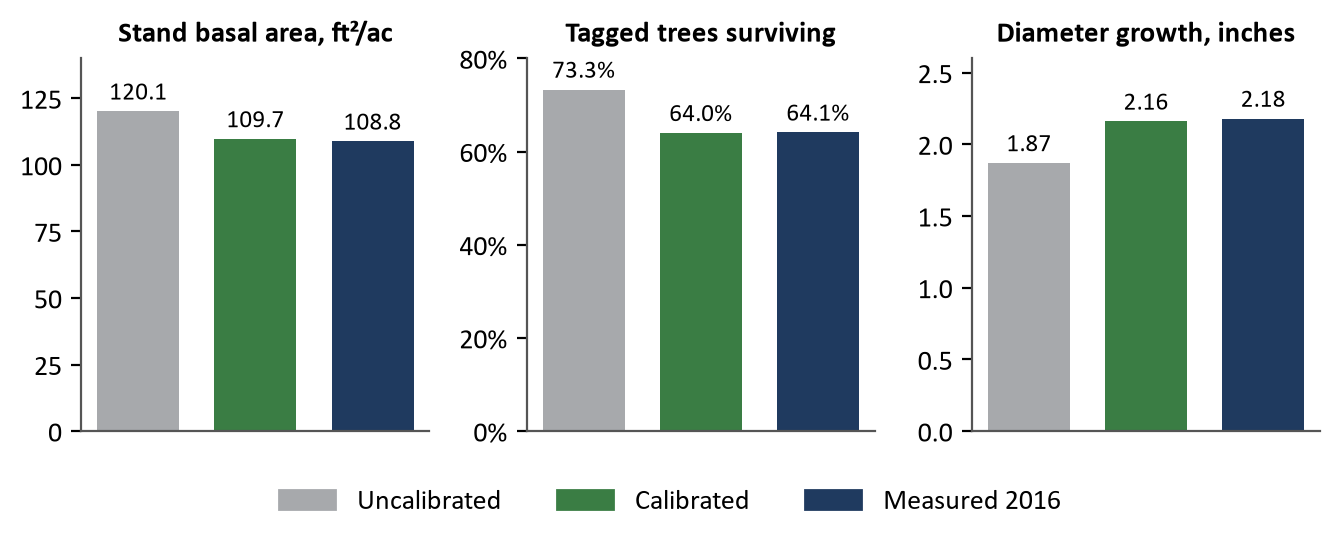
The harvested stands are the independent test, because no information from them entered the calibration. Across 450 such stands, standing basal area in 2016 averaged 109.7 ft²/ac projected against 108.8 measured. The trees left after thinning grew 2.16 inches over the 17 years against 2.18 measured, whereas the stock projection grew them 1.87 inches.
Limitations and Next Steps
This FVS calibration rests on one ownership, managed predominantly by single-tree selection, and that is the only silvicultural regime it has seen. Its other limitations are as follows:
- Height growth is not calibrated. No tree heights were measured before 2016, so the 1999 heights are estimated from diameter, and a projection from 1999 carries those estimates forward.
- The projection establishes no new seedlings, so results over the 17-year test should not be extrapolated beyond about 30 years.
- Growth after heavy harvests, removing more than 40% of the basal area, remains about 18% below measured.
Two steps remain before the calibration covers the full life of a stand: a regeneration model that estimates the establishment of new seedlings by species, and a height model fitted to the 2016 heights, from which height growth can be calibrated. A full recalibration on a documented, repeatable process will carry both.
Other Growth Models
Assisi FVS Lake States is one of several growth models in Assisi. Some run from their authors’ own compiled libraries, such as ORGANON and the Acadian model, and others are Assisi’s implementations of published models. Each runs through the same inventory, silviculture and harvest scheduling tools. What a local calibration can set depends on the model: the tree-condition, management-response and small-tree submodels described here were built for Assisi FVS Lake States. Organizations can also add growth equations of their own.
Published models such as FVS describe a region, and their large data sets make them a strong base. Every remeasured data set also holds knowledge of its own forest, and the records it holds determine what an FVS calibration can add: scaling from repeated measurements, and submodels from tree condition, management history and small-tree counts. Assisi Forest’s open database design keeps those records, the stock calibration and the local calibration together, so that each step can be estimated, tested and compared.
References
Dixon, G.E., comp. 2002 (revised 2020). Essential FVS: A User’s Guide to the Forest Vegetation Simulator. Internal Report. Fort Collins, CO: U.S. Department of Agriculture, Forest Service, Forest Management Service Center. Available from the FVS documents page.